

4 min read
The average list-to-sale ratio clocked in under 100% for the first time since March 2021 in August, according to new data released last week by Redfin.
Redfin Chief Economist Daryl Fairweather said in a statement, “while the cooldown appears to be tapering off, there are signs that there is more room for the market to ease. The post-Labor Day slowdown will likely be a little more intense this year than in previous years when the market was super tight,” Fairweather added. “Expect homes to linger on the market, which may lead to another small uptick in the share of sellers lowering their prices. Homebuyers’ budgets are increasingly stretched thin by rising rates and ongoing inflation, so sellers need to make their homes and their prices attractive to get buyers’ attention during this busy time of year.”
First, notice the key phrase….”the cooldown appears to be tapering off.” That’s the key takeaway from their report. The cooldown IS tapering off. That’s the key point to understand.
Furthermore, Redfin reported their Homebuyer Demand Index — which is a measure of homebuyer demand that takes touring activity and other homebuying requests from Redfin agents into account — was up 15 percent from its 2022 low point but down 16 percent year over year.
So what does that mean?
Overall sales activity is down from the all-time highs we saw last year. Still, most importantly, we are starting to see buyers come back into the market who were, for lack of a better way of explaining it, shocked out of the market when rates spiked earlier this year. Or, put another way, we may have already seen the bottom. Time will tell.
Understand, higher rates don’t crush demand; it just makes everything more expensive. That means buyers, over time, will adjust their expectations to the new normal of higher rates and purchase a smaller, further out, less updated home, to achieve their goal of buying a home. This is because people NEED housing. They have to live somewhere, so they adjust to the market dynamics.
The only thing that crushes demand is the inability to purchase a home. This comes from systemic failures in mortgage lending, lack of market liquidity, job loss, or restrictive lending guidelines.
Here’s the second thing you need to know about what the report said, “expect homes to linger on the market and ~ which may lead to more sellers lowering their prices.”
As we are going into the last four months of the year, which by the way, is historically the best time of year to purchase a home due to completely normal season adjustments. Buyer interest wanes at this time of year, and sellers who ARE on the market are faced with carrying the home for an additional 3-4 months as they wait for buyer activity to increase in Q1 of the following year. The potential carry costs alone are typically enough to incent a seller to accept less for their home.
Ok, now that we are all straight on that, let’s also give their report a little bit of historical context.
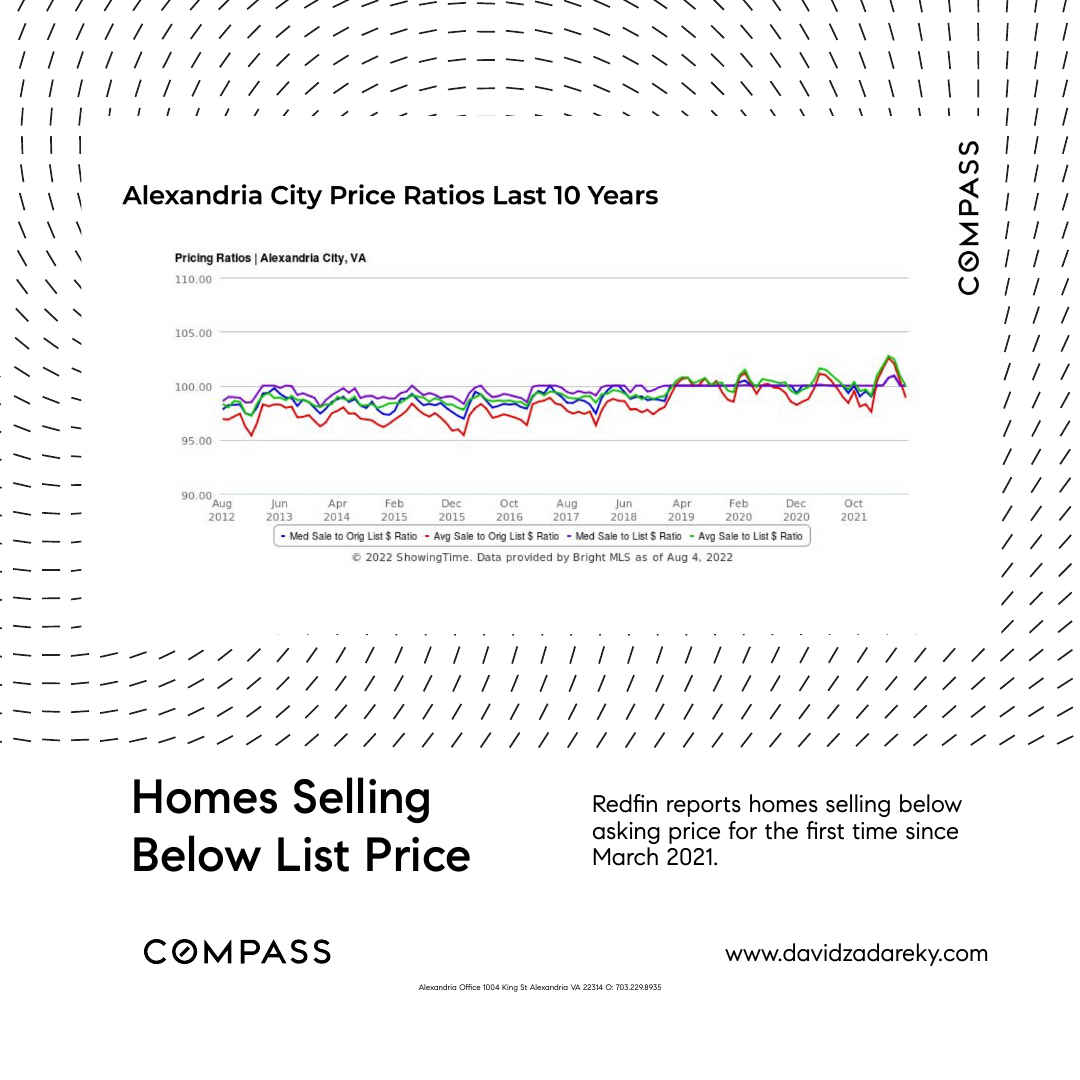
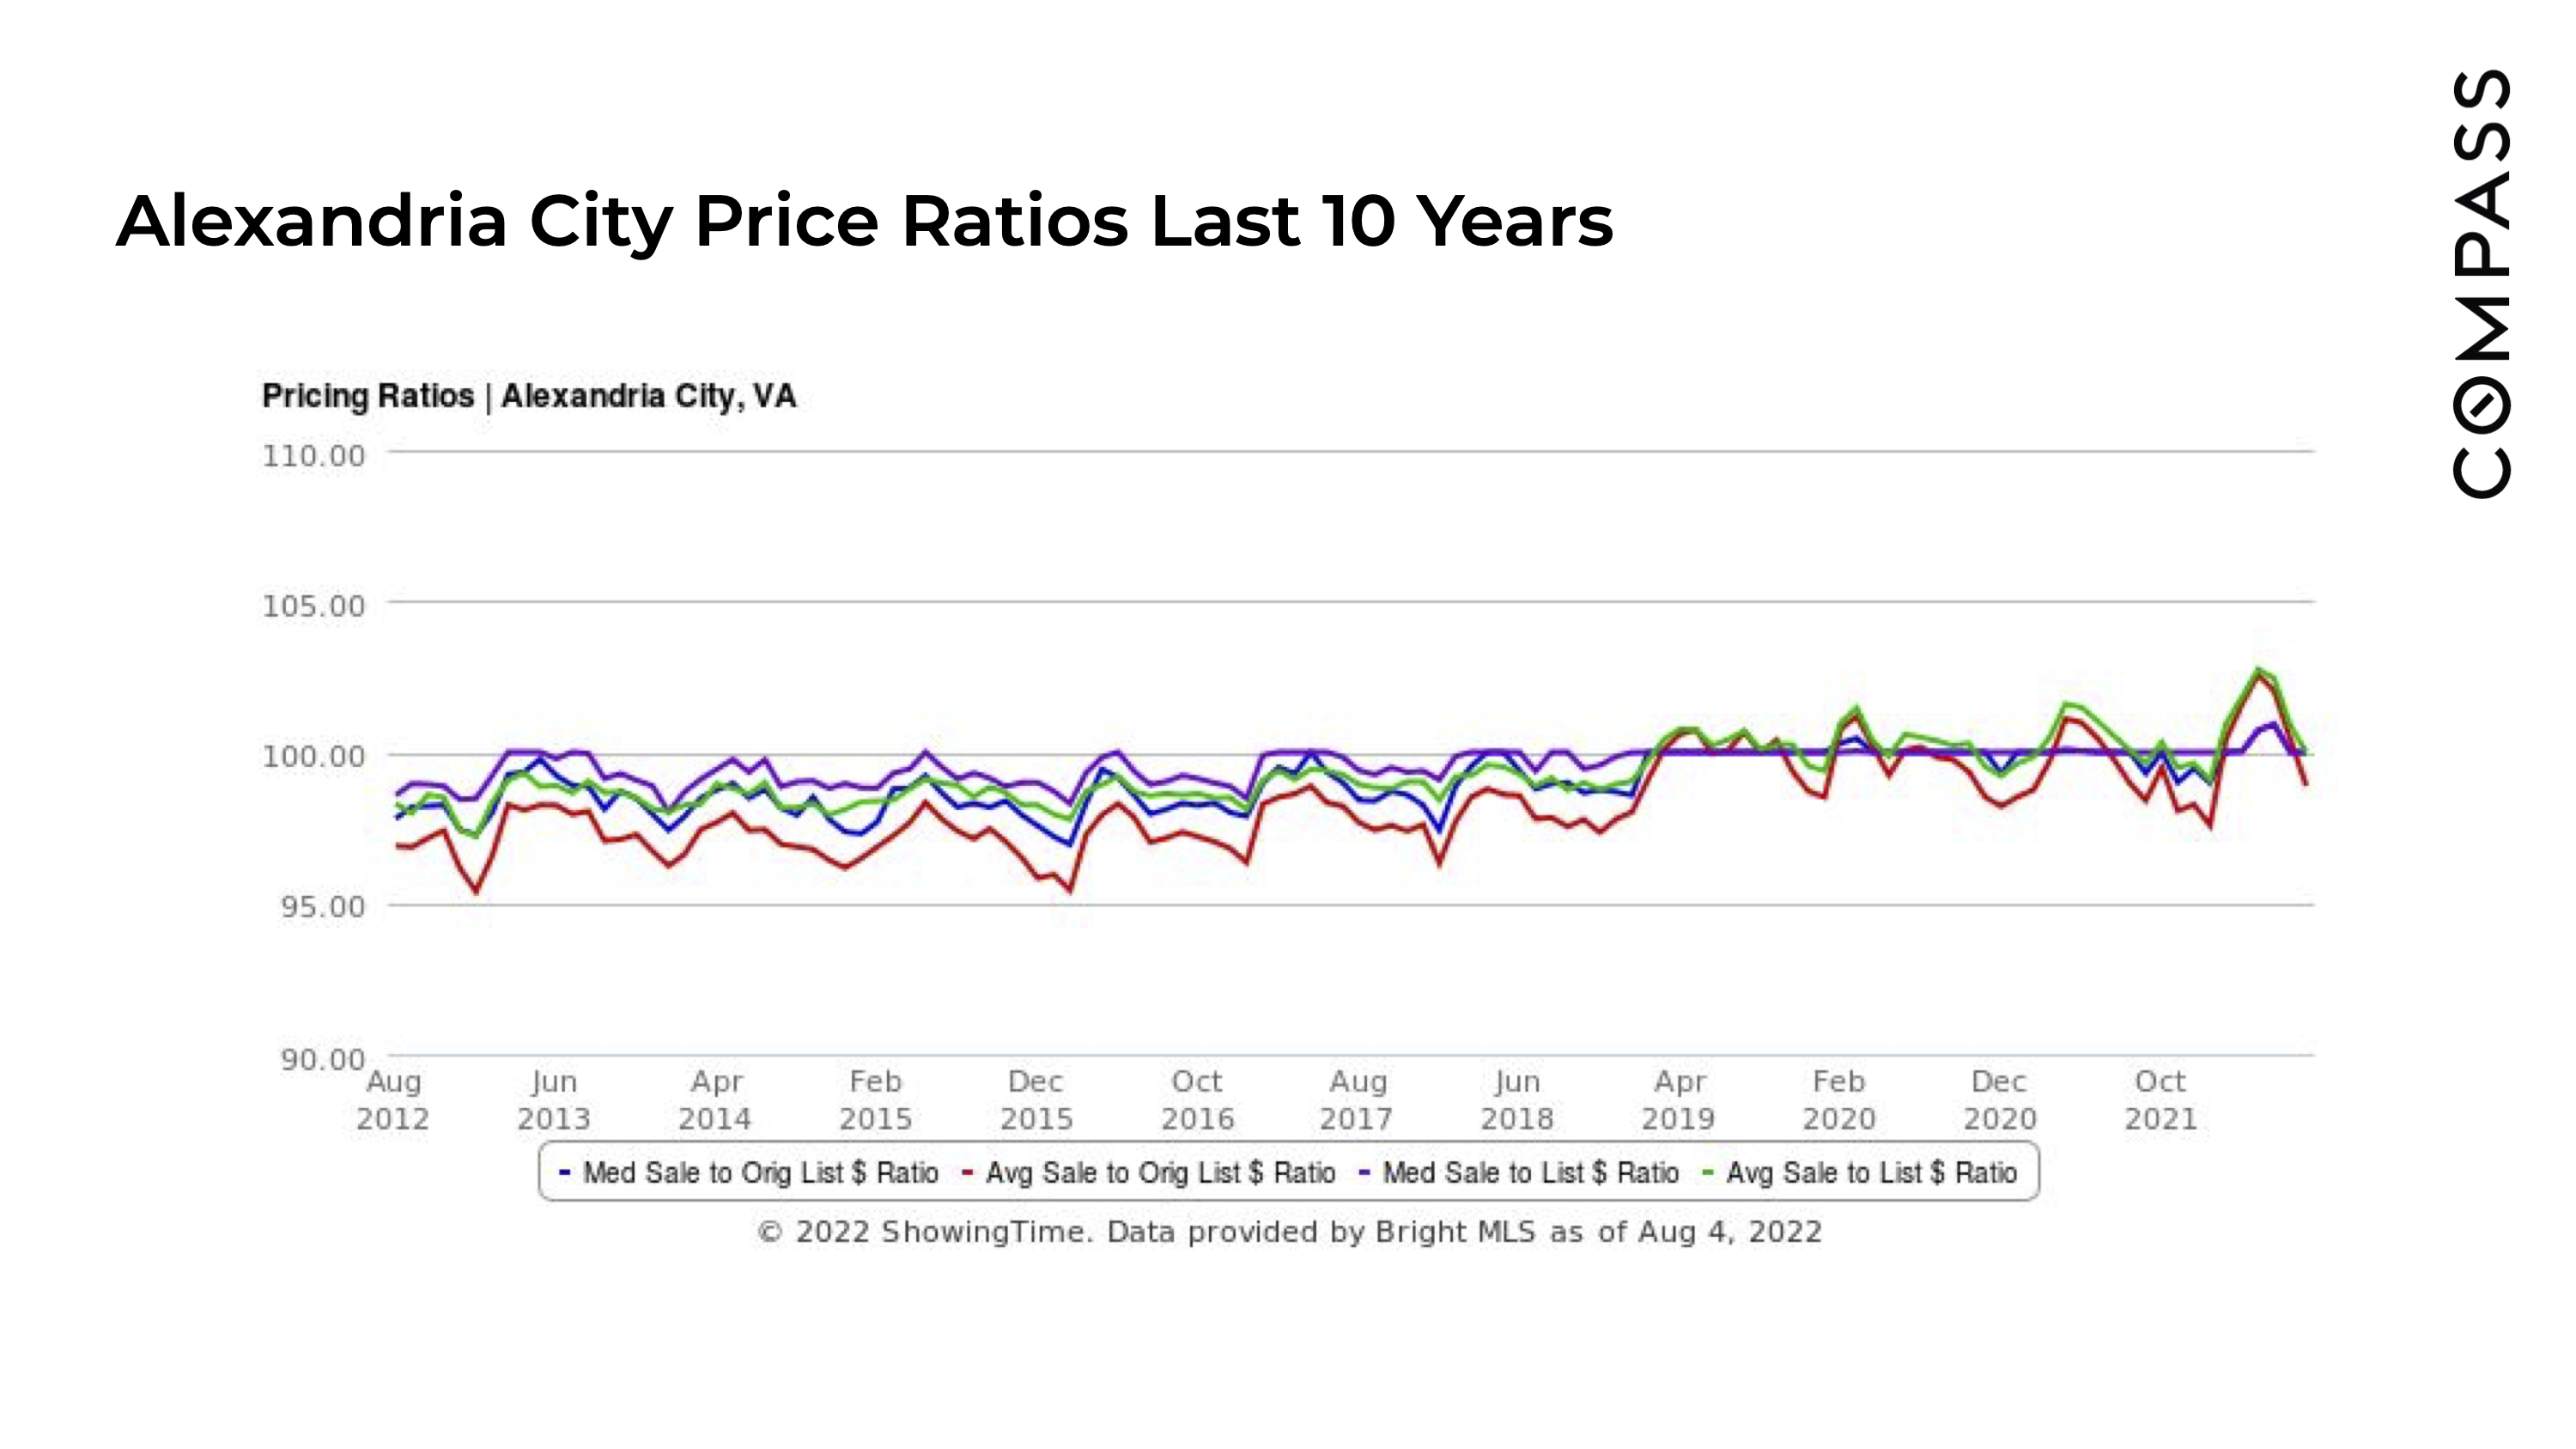
Over the long run, the Northern Virginia real estate market homes NORMALLY sell between 97-100% of the current list price. Let’s look at some charts to see what’s going on here.
First up, Alexandria City price ratios from August of 2022. You’ll see the average sold price to list ratio was 99.6% and the average sold price to the ORIGINAL list price was 98.7%. The average days on market was 19 for 211 homes sold. The average closed price was $648,273.

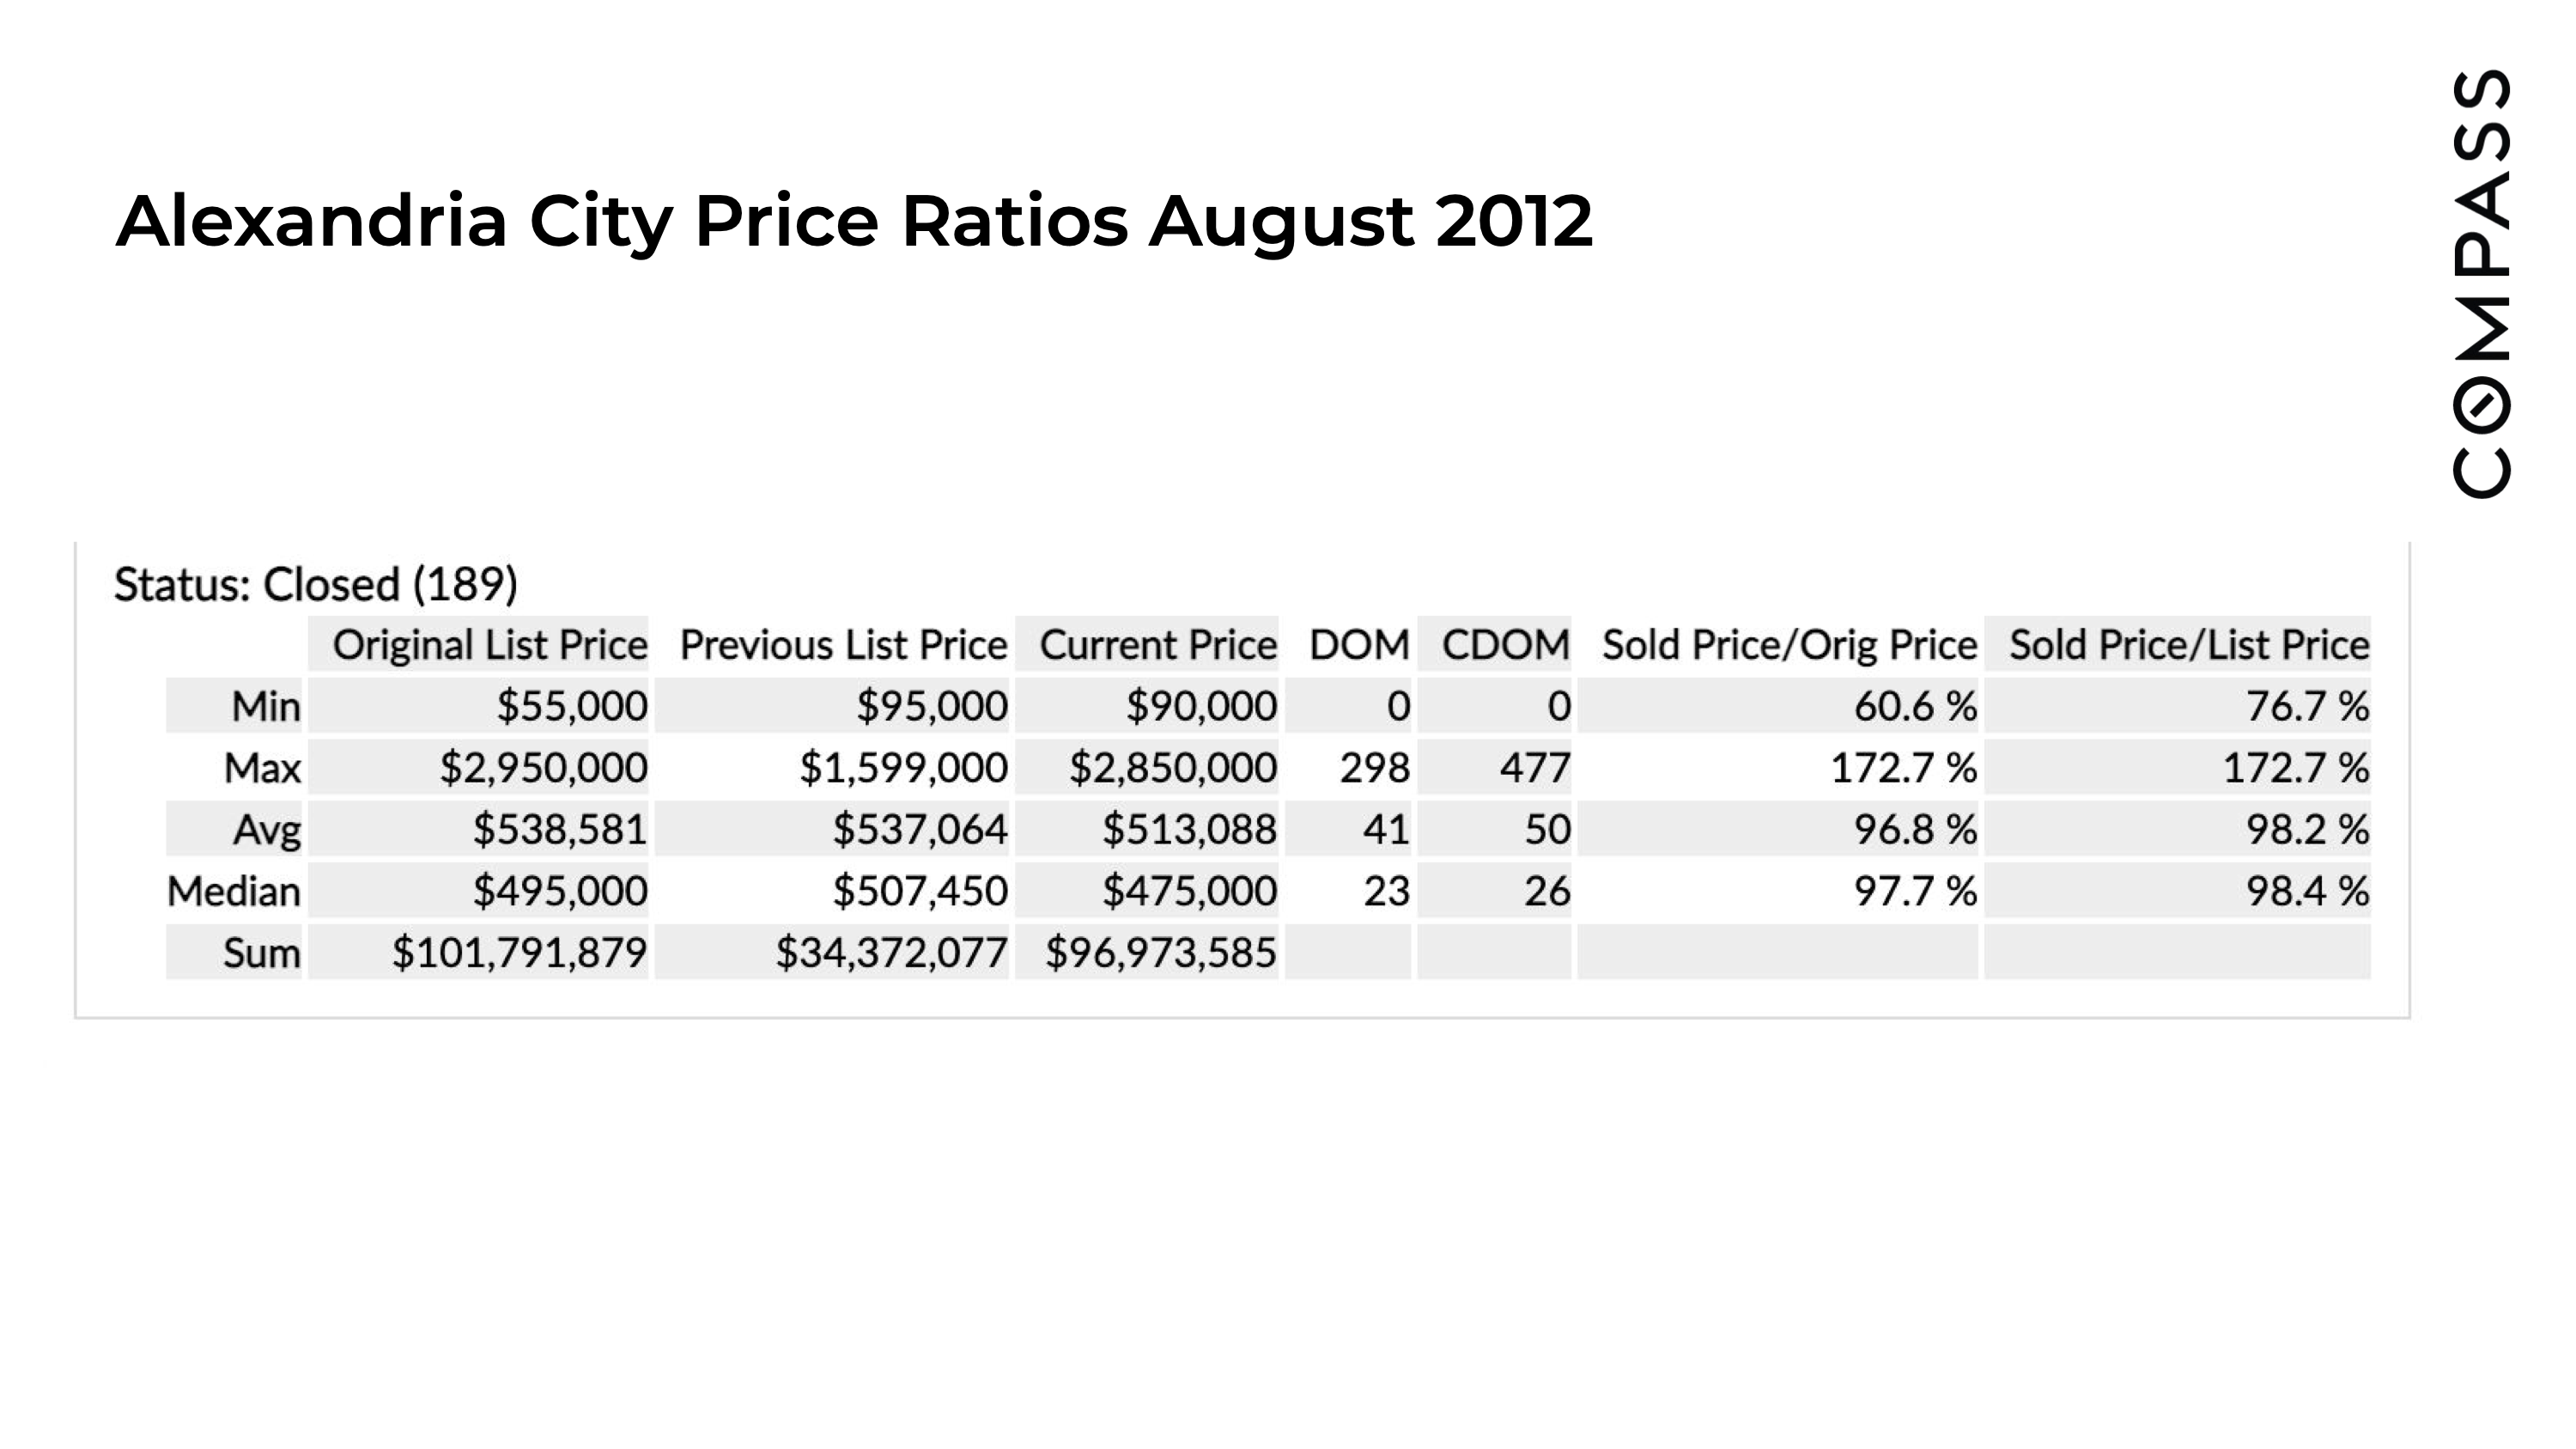
Now let’s go back to August of 2012 to give us a baseline. Here we see the average sold price to list price ratio was 98.2% and the average sold price to the ORIGINAL list price was 96.8%. The average days on market was 41 for 189 homes sold. The average closed price was $513,088.
And now, let’s go back to August of 2021 to see how the market has adjusted year of year. Here we see the average sold price to list price ratio was 100% and the average sold price to the ORIGINAL list price was 98.8%. And the average days on market was 20 for 270 homes sold. The average closed price was $655,350.

So let’s bring it all together with this last chart over the last ten years. Here we can see that normally homes sell between 97-100% of their current asking price. Even in the covid years' homes on average only sold for slightly more than the asking price. In other words, Redfin’s report is simply stating that market conditions are returning to a more historical norm, and the market is not indicating a crash.
Make sure to follow me for more market information. In my next video, I’ll address the fallacy of thinking the list price has anything to do with market value. Spoiler alert...it is actually just a starting point for a negotiation.