A Market, Not The Market
Why the MLS is one market among several, how its weekly auction works, what days on market and price history really signal, and how sellers choose a...
27 min read

Every real estate transaction happens at the human scale: one buyer and one seller making a single irreversible decision about a unique asset. But those choices don't spread evenly. The market exists as an aggregation of those decisions, but at the moment a decision is made, the aggregate disappears. The buyer is not choosing from “inventory.” They are choosing whether this specific home is the one. The seller is not negotiating with “the market.” They are deciding whether to accept one offer or none.
That individual decision is shaped by competition. Each week, a new cohort of listings and buyers enters the field while others exit it. The competitive set reconstitutes continuously as new supply appears, buyers act or hesitate, and existing listings are judged against alternatives that did not exist the week before. Intermediaries—agents, appraisers, lenders—introduce discipline at the edges through comps, appraisals, and financing constraints. They do not determine the outcome at the center. The outcome is determined when one buyer decides yes or no in one specific competitive environment.
Metrics exist to describe that competitive environment, not to replace the decision itself. Most traditional housing metrics average across time and smooth over the weekly selection process that determines individual outcomes. Saturation rate matters because it measures competition at the frequency where the competitive set actually changes: how many listings competed, how many cleared, and how many failed within a single decision cycle.
The market does not move monthly and get measured weekly. It moves weekly and gets averaged monthly.
Markets are described in aggregates, but outcomes are determined in competition and decided individually. The market doesn't exist at the scale of one. Every tool built to measure it becomes irrelevant at the moment it matters most.
| Layer | What It Is | What Determines It |
|---|---|---|
| 1. Decision | One buyer. One seller. One outcome. At the moment of decision, the aggregate disappears. | Individual willingness, emotional readiness, and life events |
| 2. Competition | The weekly cohort of listings and buyers competing within a reconstituting competitive set. | New supply and demand entering each week; the competitive set reconstitutes continuously |
| 3. Measurement | Descriptions of the competitive environment that inform the decision. | Metrics that capture how many competed, how many cleared, and how many failed |
Saturation rate is the instrument that connects measurement to competition in a way that is actionable at the moment of decision.
For decades, real estate professionals have relied on absorption rate and months of supply to guide pricing decisions. These metrics assume a static market where inventory remains constant and every home eventually sells. Neither assumption holds true anymore.
This paper presents a saturation-based framework built on a simple competitive principle: in markets where buyers have leverage, only the best listings win. In markets where sellers have leverage, only the best buyers win.
Using ten years of Northern Virginia market data, we demonstrate that pricing outcomes, days on market, and seller leverage correlate directly with weekly competitive clearance—not theoretical months of supply. The evidence is clear: demand is remarkably stable year-over-year. Supply volatility creates competition. And only the most compelling option wins each week.
Agents and sellers who understand this shift gain a decisive advantage: they stop waiting for favorable conditions and start creating competitive superiority in current conditions.
This model is intentionally simple. It doesn’t predict the future. It reads the market that exists this week, which is all sellers need in order to position themselves to win.
This framework doesn’t replace other metrics—it clarifies them by showing, each week, why most listings lose and what it takes to win. Ten years of Northern Virginia MLS data (2015–2025) show three consistent findings: • demand stays relatively stable year over year, • supply volatility creates competitive pressure for sellers or buyers, and • the weekly failure rate of listings correlates directly with DOM, price reductions, and list-to-sale ratios.
Consider two common scenarios:
Scenario 1:
A seller reviews a comparative market analysis showing 3.2 months of supply. The agent explains this indicates a "balanced market" where homes should sell within a reasonable timeframe. The seller lists at a price reflecting recent comparable sales, confident the market will absorb their home.
Eight weeks later, the home sits unsold. Competing listings have come and gone. Showings have slowed. The seller doesn't understand what went wrong—the market was supposed to be balanced.
Scenario 2:
A different seller is ready to list in November. The agent recommends waiting until spring "when buyers are more active." The seller withdraws the home from consideration, pays four months of carrying costs, and relists in March—directly into a flood of competing inventory from every other seller who received the same advice.
Both sellers followed conventional wisdom. Both strategies failed.
What happened?
In the first case, absorption rate told the seller how long it would take to sell all current inventory if no new listings appeared. But new listings appeared constantly. More importantly, buyers didn't purchase homes indiscriminately—they selected the most compelling options and rejected the rest.
In the second case, the agent confused absolute buyer volume with competitive probability. Yes, spring has more buyers. But it also has disproportionately more competition. The seller went from competing against 5 homes in November to competing against 20 homes in March—lower odds despite higher demand.
The core misunderstanding:
Both strategies assume sellers can wait for favorable market conditions to do the work for them. The data proves otherwise. Markets don't reward patience. They reward competitive superiority.
This happens thousands of times each year because the industry relies on metrics and strategies built for a different era.
Before examining why absorption rate fails, we need to establish the foundational truth that governs all real estate transactions:
In markets where buyers have leverage, only the best listings win. In markets where sellers have leverage, only the best buyers win.
Buyer willingness is not fixed. It stretches in scarcity and tightens in saturation. The market doesn’t change who buyers are, it changes what they will tolerate.
This principle is identical to what buyers learned during the 2020-2022 bidding wars—just inverted.
What buyers learned in 2020-2022:
When inventory was scarce and sellers had leverage, waiting for "better conditions" was a losing strategy. The buyers who won didn't wait for:
They won by being the best buyer in current competition:
The market didn't reward patience. It rewarded competitive superiority.
What sellers must learn in balanced or buyer markets:
When inventory is abundant and buyers have leverage, waiting for "better conditions" is equally futile. The sellers who win don't wait for:
They win by being the best listing in current competition:
Again, the market doesn't reward patience. It rewards competitive superiority.
Agents often tell sellers to "wait for spring when there are more buyers." This advice confuses absolute volume with competitive probability.
Spring facts:
The winning strategy in both seasons is identical: → Be the best listing
The only question is: in which competitive environment is it easier to be best?
We'll return to this after examining why absorption rate fails to capture any of this dynamic.
Absorption rate calculates how many months it would take to sell all active listings based on the current pace of sales, assuming no new inventory arrives.
This rests on two assumptions that no longer hold:
Absorption rate asks: "If nothing else comes to market, how long until everything sells?"
But inventory never remains static. Northern Virginia sees constant refresh cycles:
The market absorption rate describes—one where inventory freezes—does not exist.
Absorption rate implies all homes will sell given enough time.
This was occasionally true during 2020-2022 when buyers had virtually no choices and bid on anything available. It is not true now, and it was not true before the pandemic either.
Modern buyers are selective. They reject homes that are:
Absorption rate cannot account for buyer selectivity. It treats all inventory as equally likely to sell, which systematically overstates market health and gives sellers a false sense of security.
More critically: absorption rate cannot see competition.
It measures a theoretical timeline divorced from the reality that each week, buyers choose one listing and reject all others. The homes that sit aren't "waiting their turn." They're losing a weekly competition—and will continue losing until something changes.
To test whether absorption rate accurately reflects market dynamics, we analyzed ten years of Northern Virginia MLS data across multiple dimensions:
The patterns are unambiguous.
Chart: Monthly Closed Sales
Annual closed sales in Northern Virginia remain in a consistent band of 34,000-42,000 transactions year after year, despite:
Monthly volume follows identical seasonal curves every year: peaks in May-August, troughs in January, with minimal deviation from the pattern.
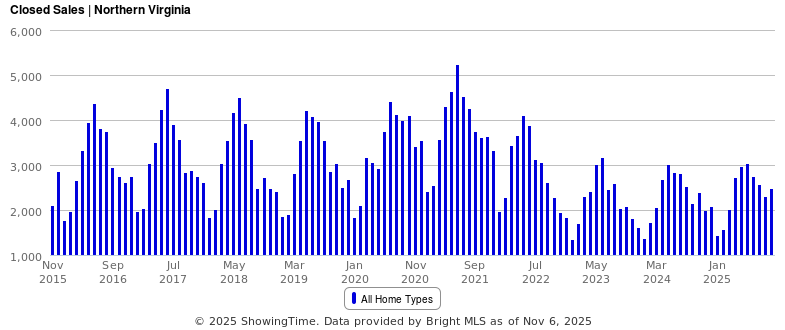
Figure 1: Northern Virginia Closed Sales (2015-2025)
Figure 1: Northern Virginia Closed Sales (2015-2025)
Annual transaction volume remains consistently between 34,000-42,000 sales despite dramatic shifts in interest rates, economic conditions, and inventory levels. Note the identical seasonal patterns repeating each year—proof that buyer demand is driven by life events, not market sentiment.
Interpretation:
Demand is driven by life events—marriage, divorce, job relocation, births, deaths, school changes. These forces can be delayed but not eliminated. The buyer pool remains durable and predictable across economic cycles.
This stability means demand is not the variable causing price volatility or competitive pressure. Buyers don't disappear. They just become more selective about what they'll accept.
Chart: Market Activity
While pending contracts (demand signal) track in tight, predictable bands, active listings and new listings swing dramatically:
The crossover points between these lines predict pricing behavior with precision:
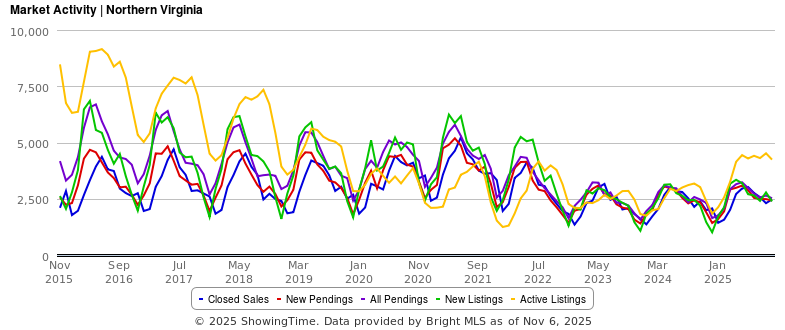
Figure 2: Market Flow Dynamics - Active Listings vs. Pending Contracts
Figure 2: Market Flow Dynamics - Active Listings vs. Pending Contracts
While pending contracts (demand) track in tight, predictable bands, active listings (supply) swing dramatically. When pendings exceed actives (2020-2022), prices surge. When actives exceed pendings (2023-2024), prices flatten. Supply volatility—not demand fluctuation—creates competitive pressure.
Interpretation:
Supply volatility—not demand fluctuation—creates competitive pressure. When supply drops relative to stable demand, buyers compete for scarce inventory. When supply rises, listings compete for buyers.
Absorption rate misses this entirely because it treats supply as static and demand as the variable. The data proves the opposite.
Chart: Pricing Trends
Median sale prices rise sharply during periods when active listings stay below pending contracts (low saturation). Prices flatten or decline when active listings exceed pendings (high saturation).
Critically, median list prices of active inventory consistently overshoot during saturated periods, creating a gap between what sellers want and what buyers will pay. This gap closes only through price reductions.
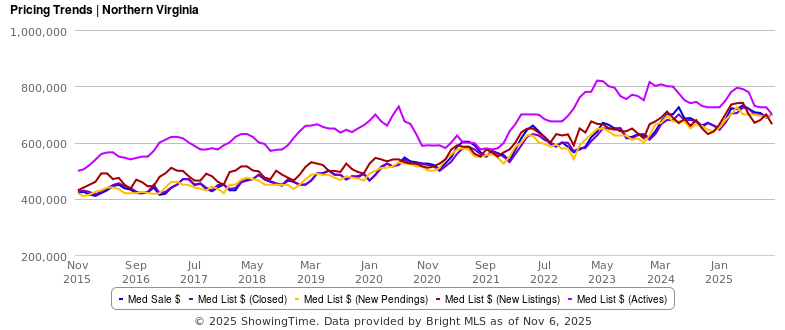
Figure 3: Pricing Trends - Sale Price vs. List Price
Figure 3: Pricing Trends - Sale Price vs. List Price
Median sale prices (blue, orange, red) follow smooth upward trajectories with brief plateaus. Active list prices (purple) consistently overshoot during saturated periods, revealing seller optimism divorced from buyer willingness. The gap closes only through price reductions.
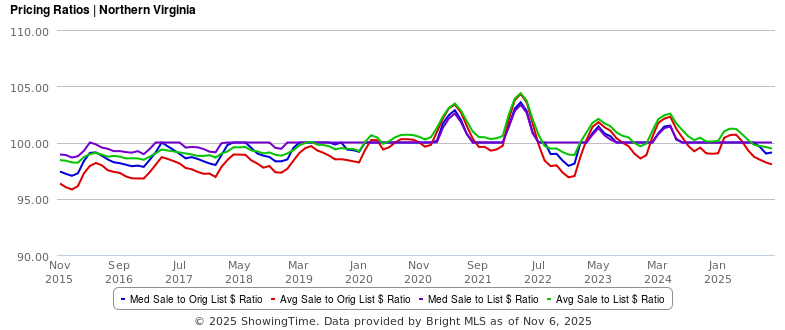
Figure 4: List-to-Sale Price Ratios
Figure 4: List-to-Sale Price Ratios
Ratios spike above 100% only during low-saturation periods (2020-2022) when buyers compete for limited inventory. During high-saturation periods, ratios compress to 95-98%, revealing buyer negotiating power and seller concessions. Pricing leverage correlates directly with clearance pressure.
Chart: Pricing Ratios
List-to-sale price ratios spike above 100% only when the market clears inventory quickly (low saturation). During high-saturation periods, ratios fall to 95-98%, indicating:
Interpretation:
Pricing outcomes are a direct function of weekly competitive pressure. Sellers gain leverage only when buyers must compete for limited inventory. When inventory saturates the market, buyers reassert selectivity and refuse to stretch.
This is the "only the best listings win" principle in action. When buyers have choices, they choose the best value. When they have no choices, they compete for what's available.
Absorption rate cannot predict these shifts because it ignores the supply-demand spread.
Chart: Days on Market
Median DOM collapses to 5-10 days during low-saturation periods and inflates to 25-40 days during high-saturation periods.
Notably, contract-to-settlement timelines remain constant across all periods at approximately 30-35 days. This proves the variability occurs on the front end (getting a contract), not the back end (closing the transaction).
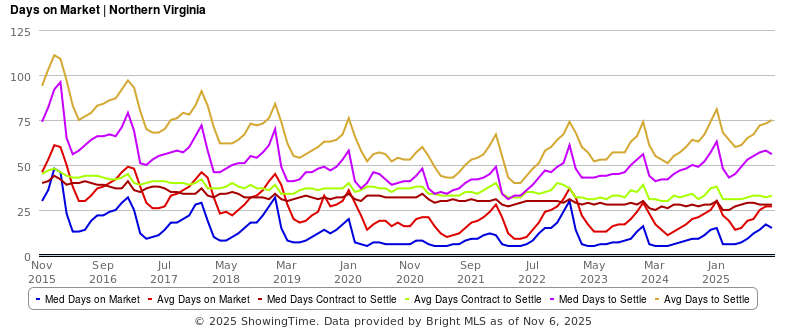
Figure 5: Days on Market - Competitive Delay vs. Transaction Timing
Figure 5: Days on Market - Competitive Delay vs. Transaction Timing
Median DOM (red, blue) collapses to 5-10 days during low saturation and inflates to 30+ days during high saturation. Contract-to-settle timelines (green) remain flat at ~30-35 days across all periods, proving DOM measures competitive failure, not transaction speed.
Interpretation:
DOM measures how long it takes a listing to win the weekly competition, not how long transactions take to close. When the market is saturated, most listings lose the weekly clearance battle repeatedly until they either reduce price or withdraw.
Extended DOM is the symptom of competitive failure, not of "slow markets" or "patient buyers." Buyers aren't waiting. They're buying other homes.
This is invisible to absorption rate, which assumes time alone solves the problem.
Chart: $ Per SqFt
During low-saturation periods (2020-2022), $/sqft jumps from the $250s into the $300+ range—a 20%+ increase—despite no fundamental changes to housing stock quality or size.
During high-saturation periods (2017-2018, 2023-2024), $/sqft flattens completely, showing buyers refuse to pay premium pricing when alternatives exist.
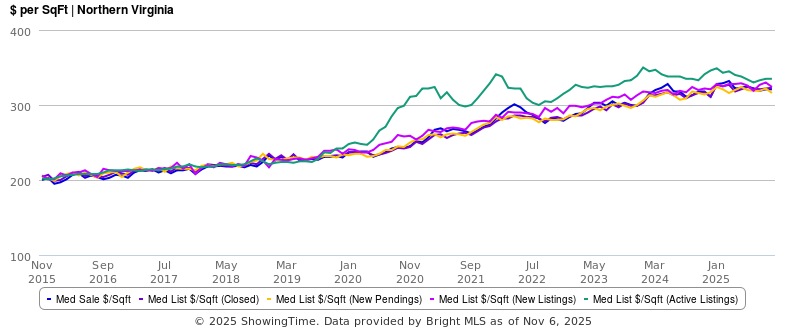
Figure 6: Price Per Square Foot - Competitive Premium Behavior
Figure 6: Price Per Square Foot - Competitive Premium Behavior
During low-saturation periods (2020-2022), $/sqft jumps 20%+ despite no fundamental changes to housing stock. During high-saturation periods, $/sqft plateaus completely. Buyers pay competitive premiums only when forced by scarcity, not when alternatives exist.
Interpretation:
Buyers pay competitive premiums only under pressure. When saturation is low, even average-condition homes command premium $/sqft because buyers have limited choices. When saturation is high, only renovated or exceptionally presented homes break above baseline pricing.
This is the clearest demonstration that being the "best listing" is conditional on competition level. In low saturation, "good enough" wins. In high saturation, only "undeniably superior" wins.
This selectivity is the core dynamic absorption rate cannot capture.
Chart: Supply & Demand Metrics
Contract ratio (pending sales / active listings) moves more quickly than months of supply or absorption rate, showing some correlation with market shifts. However, it still suffers from critical interpretive flaws.
The "Equal Probability" Fallacy:
When contract ratio shows 10% (1 out of 10 homes going under contract), conventional interpretation suggests "each listing has a 10% chance of selling."
This is false.
Buyers don't randomly select from available inventory. They identify the most compelling option and ignore the rest. In a 1-out-of-10 week:
The market doesn't flip a fair coin. It runs a winner-take-most competition based on buyer preferences.
Contract ratio measures outcomes but obscures the competitive mechanism. It tells you how many won without explaining why the rest lost.
It treats all listings as if they have an equal chance of selling. In reality, buyer choice is highly skewed. In a 10-listing competitive set, one listing may hold a higher percent probability of selling that week because it matches buyer preferences. Several others have lower probability regardless of contract ratio. Saturation reveals this skew because it centers the failure rate rather than the averaged success rate.
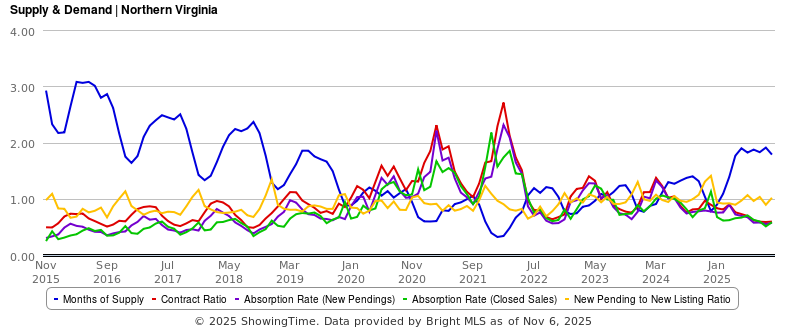
Figure 7: Traditional Metrics vs. Real-Time Signals
Figure 7: Traditional Metrics vs. Real-Time Signals
Months of supply (blue) and absorption rate (green, purple) lag market shifts by weeks or months. Contract ratio (black) and new pending-to-new listing ratio (yellow) respond faster but still assume equal probability among listings. None capture the winner-take-most dynamic that saturation rate reveals.
Across the ten-year data set, saturation rate consistently responded to market shifts 2–4 weeks earlier than months of supply and 1–2 weeks earlier than contract ratio. In seller consultations, this early signal is the difference between pricing ahead of the curve or chasing reductions.
This matters because: agents looking at 10% contract ratio think "we have a reasonable chance." The reality is: "we have almost no chance unless we're clearly the best option."
Saturation rate measures the percentage of listings that failed to clear within a defined competitive set during a single weekly decision cycle. It is not a forecasting model. It is a weekly diagnostic of competitive failure and clearance.
Saturation asks one question: of the listings competing for buyers this week, how many did not secure a buyer?
Formula: Saturation Rate = (Active Listings - New Pendings) / Active Listings
If 10 homes are active and 1 sells this week, the market is 90% saturated.
If 10 homes are active and 6 sell, the market is 40% saturated.
While mathematically related (saturation ≈ 1 - contract ratio), the frameworks diverge in three critical ways:
1. Saturation Centers Rejection as the Driver
Contract ratio describes successes. Saturation focuses on the volume of failure and what it reveals about buyer refusal patterns.
This shift matters because:
When 9 out of 10 listings fail to sell, the question isn't "what did the winner do right?" It's "what made buyers reject the other 9?"
2. Saturation Rejects the Equal Probability Assumption
Rather than suggesting "each listing has an X% chance," saturation explicitly acknowledges:
This is psychologically critical for seller conversations. Contract ratio creates false hope ("we have a 10% chance"). Saturation creates urgency ("90% of our competition is failing—we need to be in the 10% that wins").
Why saturation beats contract ratio:
3. Saturation Connects Data to Strategy
Contract ratio is typically presented as a descriptive statistic. Saturation becomes an operating system with clear decision thresholds.
Based on aggregated national data and ten years of NOVA MLS patterns:
| Market Type | Strong Seller Market | Neutral/Balanced | Strong Buyer Market |
|---|---|---|---|
| Saturation Rate | 0-40% | 40-70% | 70-100% |
| Weekly Clearance | 60-100% | 30-60% | 0-30% |
| Median DOM | 5-12 days | 14-21 days | 30+ days |
| Price Projection | +6% to +11% annually | -2% to +3% annually | -5% to -12% annually |
These bands are directional, not absolute, and derived from observed patterns and subject to refinement as additional data accumulates. They are intended for operational decision-making rather than statistical finality. Local variations exist, but the behavioral pattern remains consistent: as weekly failure rates rise, the burden on a listing to stand out rises with them.
The definition of competitive superiority changes based on how much competition exists:
In Low Saturation (0-40%): Sellers Have Leverage
"Best" means:
You don't need to be perfect. You just need to be good enough to trigger competition among multiple buyers.
In High Saturation (70-100%): Buyers Have Leverage
"Best" means:
You need to be undeniably better than alternatives, because buyers are comparing everything and will pass on anything that doesn't clearly win.
This is where most listings fail. Sellers position at "average price for average condition" and wonder why they sit. The answer: average loses to superior in saturated markets.
In Neutral Saturation (40-70%): Balanced
"Best" means:
You need to be noticeably better than the middle of the pack, but you don't need to dominate.
When one out of ten listings sells each week, each listing competes in a nine-to-one environment. But those odds aren't evenly shared—they're concentrated on the best-positioned home.
This mirrors bidding-war behavior but in reverse. During 2020-2022, sellers experienced what buyers now experience: being one option among many, where only the most compelling choice wins.
The psychology is identical: second place equals last place. The listing that's $15K cheaper than the winner doesn't get a consolation prize. It gets ignored.
Only certain homes sell each week. The rest accumulate days on market and eventually reduce price or withdraw.
Absorption rate implies all homes will sell eventually. Saturation acknowledges that many homes don't sell at all—they fail the weekly competition repeatedly until the seller capitulates or exits.
This is the hardest truth for sellers to accept: your home isn't "waiting its turn." It's losing a competition every single week it sits unsold.
When sellers withdraw in November and December, months-of-supply calculations fall artificially. The market appears to tighten. Then January hits, 100 new listings drop simultaneously, and sellers wonder where the buyers went.
Saturation rate captures this immediately because it measures real-time clearance, not hypothetical timelines.
The data proves this pattern repeats every single year. Yet agents continue advising sellers to "wait for spring" as if it's a secret strategy rather than what everyone else is doing.
Here's what agents miss when they say "wait for spring":
Chart: Market Activity (New Listings)
Every year shows the same pattern:
Chart: Market Activity (Pendings)
Pending contracts follow a seasonal curve but much less dramatically:
The Math:
What this means:
Yes, spring has more buyers in absolute terms. But competition rises faster than demand. Your probability of being the best listing among 20 alternatives is LOWER than being the best among 5 alternatives—even though there are more buyers shopping.
The only reliable advantage in spring is: if you can definitively be the best listing in a larger pool. If you can't, you're better off competing in a smaller pool where being "best" is achievable.
Understanding buyer psychology is critical to understanding why saturation creates winners and losers.
The ten-year data reveals three distinct buyer segments with different motivations and decision speeds:
What they want: Turnkey condition
What they'll pay: Premium $/sqft
How they decide: Quickly—they know it when they see it
Market share: 60-70% of transactions
These buyers are employed professionals with families who value their time over marginal savings. Their alternative to buying a perfect home is months of renovation while living in chaos. They'll pay $20K-50K more to avoid that.
Key insight: This is the largest and fastest-moving buyer pool. Premium-condition homes experience lower effective saturation because they're competing for the most abundant buyer segment.
What they want: Lowest possible price
What they'll accept: Any condition if math works
How they decide: Quickly—they run numbers and execute
Market share: 15-20% of transactions
These buyers are investors, flippers, or skilled DIY-oriented owners. They're not emotional. They calculate ARV minus renovation costs minus carrying costs minus profit margin. If your price hits their number, they buy. If not, they move on.
Key insight: Value properties don't compete with premium or average homes—they compete only with other distressed inventory. Their saturation is independent of overall market saturation.
What they want: Good condition at value pricing
What they'll accept: Compromises, reluctantly
How they decide: Slowly—endless comparison shopping
Market share: 15-20% of transactions
These buyers want a deal that doesn't exist: premium condition at discount pricing. They're looking for someone else to leave money on the table.
Key insight: This is the hardest segment to convert. They shop for months, tour dozens of homes, and often don't buy at all.
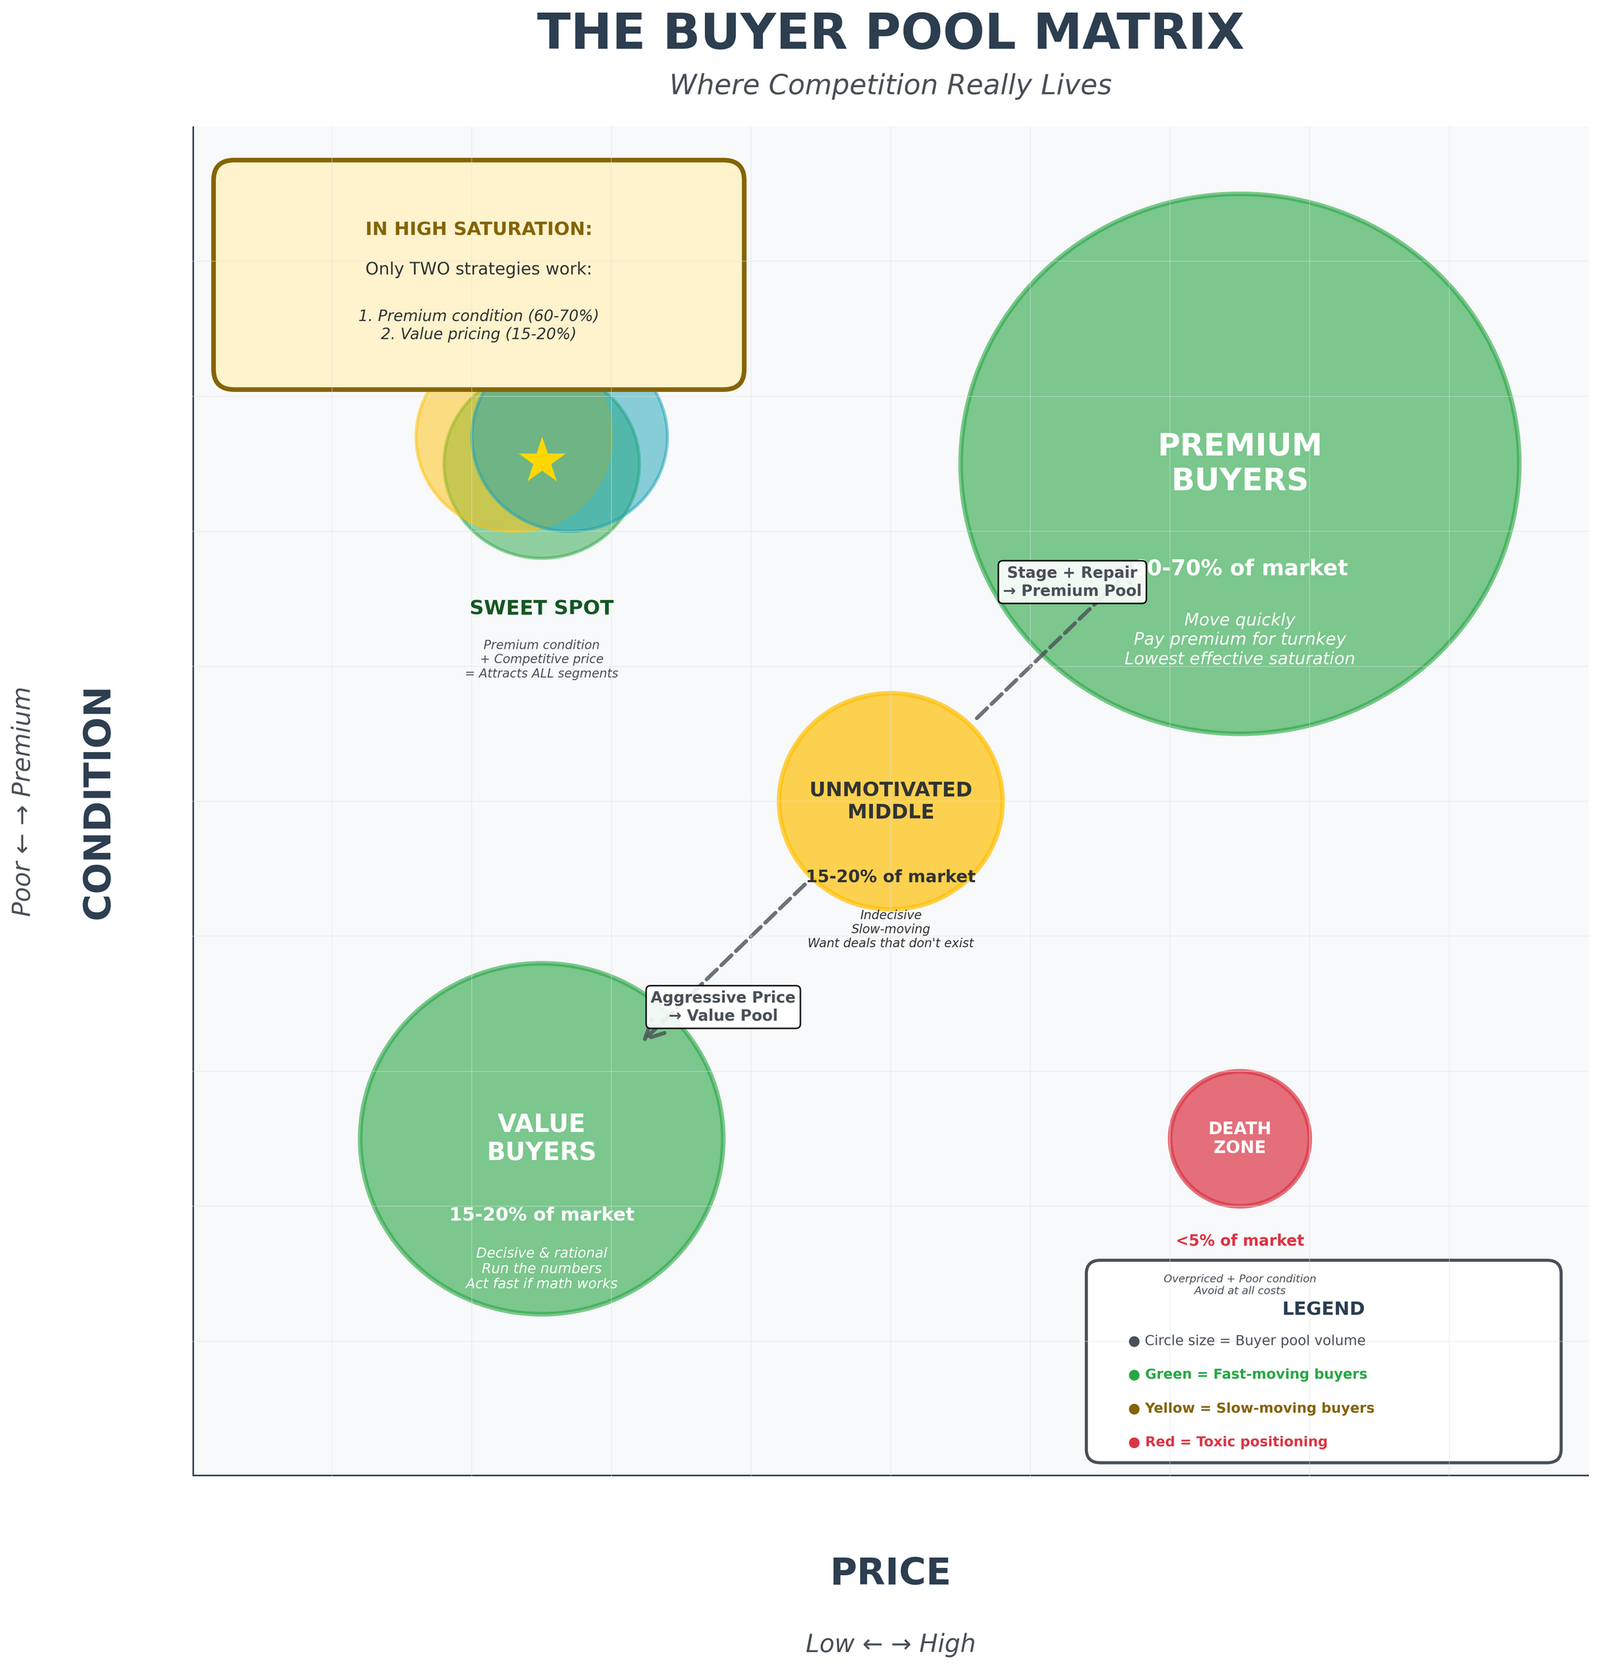
Figure 9: The Buyer Pool Matrix - Where Competition Really Lives
Figure 9: The Buyer Pool Matrix - Where Competition Really Lives
Circle size represents buyer pool volume. Premium buyers (60-70% of market, top right) are the largest and fastest-moving segment. Value buyers (15-20%, bottom left) are small but decisive. The unmotivated middle (15-20%, center) is the smallest, slowest segment—and where most average-condition listings get trapped. In high saturation markets, only premium and value positioning reliably clear inventory. The arrows show the two viable strategic movements from the middle: improve condition or drop price.
When agents price average-condition homes at average prices in high-saturation markets, they're positioning for the smallest, most indecisive buyer segment.
Premium buyers reject them (not turnkey enough)
Value buyers reject them (not cheap enough)
Middle buyers shop endlessly (hoping for someone to discount)
The result: extended DOM, price reductions, and eventual capitulation.
The solution: escape the middle by moving decisively toward premium OR value.
Premium strategy:
Value strategy:
The fatal mistake: staying in the middle with average condition at average pricing. There is no competitive advantage. You're asking the smallest buyer pool to choose you over better AND cheaper alternatives.
This is why saturation kills middle-tier listings first. They have no clear reason to win.
The strategies that won bidding wars for buyers are identical to the strategies that win saturation battles for sellers.
The competitive dynamics are the same—just inverted.
1. Aggressive Price Positioning
What they understood: "Second place is the same as last place. Being close to the top doesn't matter. Only being THE top matters."
2. Removed All Friction
What they understood: "Sellers aren't just choosing the highest price. They're choosing the offer with the least risk of falling apart."
3. Optimized Presentation
What they understood: "Sellers are human. If I can make them see me as the right steward of their home, I have an edge."
4. Speed and Decisiveness
What they understood: "If I wait, someone else will win. Hesitation equals losing."
5. Trusted Expert Guidance
What they understood: "My agent sees 50 transactions a year. I buy a house once a decade. If they say escalate $30K, we escalate $30K."
The strategies are parallel:
| What Buyers Did (2020-2022) | What Sellers Should Do |
| Offered above asking price | Price below current competition |
| Waived inspections | Pre-inspect and disclose everything |
| Waived appraisal gaps | Offer warranties or repair credits |
| Removed contingencies | Welcome contingencies |
| Flexible closing/possession dates | Flexible closing/possession dates |
| Personal letters to sellers | Emotional listing copy for buyers |
| Professional offer presentation | Professional photography and staging |
| Made offers within hours | Accept offers within hours |
| Trusted agent guidance completely | Trust agent pricing completely |
| Understood second place = last place | Understand second-best value = ignored |
Most sellers lived through the bidding wars. They either:
Either way, they understand the psychology.
When you say "you need to do what buyers did in 2021—just inverted," they immediately get it because they experienced it.
It removes the shame of aggressive pricing: Instead of "you're pricing too low," it becomes "you're pricing to win, just like buyers had to offer above asking to win."
It removes the fear of leaving money on table: Instead of "you're losing value," it becomes "you're capturing the buyer before they find an alternative, just like buyers had to act fast or lose the home."
It creates urgency: Instead of "let's wait and see," it becomes "hesitation killed buyers in 2021, and it kills sellers in 2025."
Sellers resist aggressive pricing because it feels like giving up leverage.
But bidding-war buyers felt the same way. They didn't want to waive inspections. They didn't want to offer $40K over asking. They didn't want to remove contingencies.
But they wanted to WIN more than they wanted to feel comfortable.
That's the mindset shift sellers need.
You can be comfortable and lose, or you can be aggressive and win.
There is no third option in a saturated market.
Now we return to the seasonal timing question with the full framework in place.
They're thinking about March-May when:
None of this is wrong. Spring genuinely has more buyers.
Chart: Market Activity (New Listings vs. Pendings)
Every year shows the same pattern:
Figure 8: The Spring Inventory Surge
Figure 8: The Spring Inventory Surge
New listings (yellow) drop to annual lows in November-December (~2,500), then surge dramatically beginning in January, peaking in March-April (~4,500+). Pending contracts (purple) rise modestly from ~2,500 to ~3,500. Result: Competition increases 80% while demand increases 40%. Spring odds worsen despite higher buyer volume.
Translation:
Yes, there are 40% more buyers in spring.
But there are 80% more competing listings.
Your probability of being the "best listing" goes DOWN, not up, because the competitive pool gets larger.
Agents tell sellers to wait for spring because "more buyers = better odds."
The data says the opposite:
Option A: Sell in November-December
Option B: Wait for March-April
The winning strategy in BOTH cases is identical: be the best listing.
The question is: in which environment is it easier to achieve "best"?
The answer: smaller competitive pools, not larger ones.
Beyond competitive probability, there's a risk management argument: Now is knowable, the future is hard to predict.
Example November 2025 is knowable:
Example March 2026 is unknowable:
Why gamble on uncertain future conditions when you can act in known, favorable present conditions?
If you're sitting on a vacant home or paying two mortgages, the math is brutal:
Monthly carrying costs: $3,000-7,000
Four months of waiting: $12,000-28,000
If selling now at 97% of potential spring price nets you 3% less but avoids $15,000 in carrying costs, you're ahead.
And that assumes spring delivers 100% of hoped-for pricing—which the data shows is unlikely if you're not clearly the best listing in a larger pool.
There IS a spring advantage—but not the one agents think.
The conventional wisdom: "Launch in March-April when buyers are most active."
The data-driven strategy: "Launch in January-February when inventory is still low but buyer activity is beginning to accelerate."
Chart: Market Activity
The true "early spring" window is late January through mid-February:
Possible Challenge: you're in late November 2025 right now. That January-February window is 6-10 weeks away.
Six weeks of:
Versus:
The rational choice: act now unless you have compelling reason to believe your competitive position improves by waiting. If you're waiting for higher prices, you could in theory wait forever. Therefore, choose a time to sell that best fits your life, not the calendar.
Absorption rate is only useful if inventory doesn't change and buyers treat all homes equally. Neither condition exists.
The ten-year data shows supply refreshes constantly and buyers cherry-pick inventory based on condition, price, and presentation. Absorption rate therefore creates false confidence—it can suggest a "tight" market even when a wave of new inventory is about to arrive, or suggest all homes will sell when half will sit unsold for months.
More fundamentally: absorption rate measures a theoretical timeline, not competitive reality. Saturation measures actual weekly clearance and rejection patterns.
Industry standards should reflect reality, not tradition. Months of supply was developed in a pre-internet era when markets moved slowly and information was scarce. Modern markets shift week to week, and buyers have perfect visibility into all options.
The confusion isn't from adopting a better metric—it's from continuing to use one that no longer works while wondering why listings sit.
They're mathematically related but conceptually distinct. Contract ratio is typically used as a blunt success statistic that quietly assumes every listing has equal probability of selling.
Saturation focuses on the volume of failure and the winner-take-most dynamic of buyer choice. It explicitly acknowledges that when 1 out of 10 sells, one home had a significantly higher probability and nine had significantly less—because buyers don't randomly select, they identify the best option and ignore the rest.
That distinction matters strategically. Contract ratio describes outcomes. Saturation explains the competitive mechanism and guides positioning decisions.
More importantly: saturation connects directly to the "only the best listings win" principle. It measures rejection, which is where strategy lives.
The data shows absorption rate and months of supply perform poorly in all conditions:
There is no market condition where absorption rate provides better information than saturation rate.
More importantly: the "only the best listings win" principle applies in ALL conditions. The definition of "best" changes, but the principle holds.
That's a sales problem, not a logic problem. Sellers accepted aggressive buyer offers in 2021 when agents explained the competitive reality clearly.
The framework gives you tools to make the case:
The sellers who resist aren't rejecting the logic—they're rejecting the discomfort of aggressive positioning. Your job is to analyze and explain the risk of sitting unsold relative to the perceived discomfort of pricing to win.
1. Calculate Weekly Saturation in Your Market Segment
Track active listings for the week vs. new pendings for the week, each week in your specific competitive set relative to the subject property:
Example:
Calculate: (Actives - New Pendings) / Actives = Saturation %
2. Position Pricing Based on Saturation Thresholds
3. Educate on Weekly Competition
Show:
You are not competing against "three months of inventory"—you are competing against this week's best options.
4. Define "Best Listing" for Current Conditions
Based on saturation level, determine exactly what "winning" requires:
Low saturation: "Good presentation + reasonable price wins"
Neutral saturation: "Precision pricing + solid presentation wins"
High saturation: "We need to be obviously superior on price OR condition—preferably both"
5. Use the Bidding War Parallel
When you choose to resist aggressive positioning:
"Remember 2021 when buyers had to offer $40K over asking? They didn't want to pay that—but they wanted to WIN. You're in the same situation now, just inverted. You either commit to winning or you commit to sitting."
6. Show the Spring Trap Data
Pull up Market Activity chart:
"Everyone's telling me to wait for spring. Look what happens: new listings spike in March. You'll be competing against 20 homes instead of 5. Your odds get WORSE, not better, despite more buyer, unless your home is extraordinary."
7. Calculate Carrying Costs vs. Pricing Strategy
Show net sheet scenarios:
"Price to win now at 97% of your ideal price, nets $X after zero carrying costs. If you wait 4 months and achieve 100% of your ideal price—which is may or may not happen—you net $X minus $15K in carrying costs. The math likely favors acting now if you are ready."
1. Understand You're Competing Weekly, Not Monthly
Your home doesn't sell because "the market" eventually absorbs it. It sells because a buyer this week chooses it over every other option.
2. Ask Your Agent for Saturation Data
Request: "What percentage of listings in my segment sold vs. sat last week?"
This gives you real competitive intelligence, not theoretical timelines.
3. Recognize That Time Doesn't Solve Bad Positioning
If your home isn't the most compelling option this week, it won't be next week either—unless you change something (price, presentation, terms).
Extended DOM doesn't mean "patient buyers are coming." It means "we're losing the weekly competition."
4. Define What "Best Listing" Means for Your Saturation Level
Ask your agent:
"At current saturation, what does 'winning' require? Price? Condition? Both?"
Then decide: can you achieve that standard? If not, should you wait until you can?
5. Calculate Your Carrying Costs
Monthly mortgage + taxes + insurance + utilities + opportunity cost = $3K-5K/month
Four months of waiting = $12K-20K
Ask: "If I price to win now and net 3% less but avoid carrying costs, am I ahead?"
Often the answer is yes.
6. Stop Comparing to Aspirational Outcomes
Don't compare your potential sale to:
Compare to: What will actually win this week's competition?
That's the only number that matters.
7. Embrace the Bidding War Mindset
The buyers who won in 2021 didn't enjoy overpaying. They wanted to win MORE than they wanted to feel comfortable.
You're in the same position now. You can be comfortable and lose, or aggressive and win.
Second place is the same as last place.
The real estate industry has relied on absorption rate because it was the best tool available in a slower, information-scarce era. But markets have fundamentally changed:
Absorption rate cannot capture any of this. It assumes a world that no longer exists.
Saturation rate measures what actually matters: how many homes are winning the weekly competition, and how many are being left behind.
The data across ten years is unambiguous:
In markets where buyers have leverage, only the best listings win. In markets where sellers have leverage, only the best buyers win.
Buyer willingness is not fixed. It stretches in scarcity and tightens in saturation. The market doesn’t change who buyers are, it changes what they will tolerate.
This principle held true in the 2020-2022 bidding wars. It holds true in the post April 2025 saturation battles. It will hold true in every future market cycle.
The market doesn't reward patience. It rewards competitive superiority.
Agents and sellers who adopt this mindset will:
Because in a saturated market, the only listings that sell are the ones buyers truly want.
And being what buyers want is entirely within your control.
This section defines the metric, data inputs, and competitive-set rules required to reproduce weekly saturation calculations in any market.
This methods appendix is designed for repeatability, not academic validation. Real-estate markets move too quickly for formal research cycles. The rules here are practical defaults that allow any agent to calculate saturation consistently and use it for live pricing decisions.
Weekly Saturation Rate = (Active Listings – New Pendings) ÷ Active Listings
Interpretation:
A listing must be evaluated within a micro-market where buyers cross-shop naturally.
Default rules:
All measurements use a Wednesday–Tuesday window.
The model is diagnostic, not predictive. It reads this week’s competition for buyers.
Competitive set: 24 actives at start of week
New pendings this week: 5
Saturation = (24 – 5) ÷ 24 = 79 percent
Interpretation: strong buyer power and elevated risk for average-condition homes
For more on the whole process, see how I approach selling and buying, or compare On-MLS vs Off-MLS.
This article is based on ten years of Northern Virginia MLS data (2015-2025) and incorporates national market research from Zillow, Redfin, and BrightMLS. Charts and data visualizations are derived from aggregated transaction records across multiple property types and price segments.

Why the MLS is one market among several, how its weekly auction works, what days on market and price history really signal, and how sellers choose a...

Preparing to sell in Northern Virginia? Which repairs pay for themselves before listing, which don't, and why buyers deduct more than a repair...

Your home has no single true value, only a range. How condition and competition decide where you land in it, and why "sold over asking" can mislead...